Frontend-to-backend trace propagation 
By default, Faro collects browser-side traces but they're not connected to your backend spans in Tempo. With trace propagation, you get end-to-end visibility: a single trace that follows a user action from the browser through your backend services.
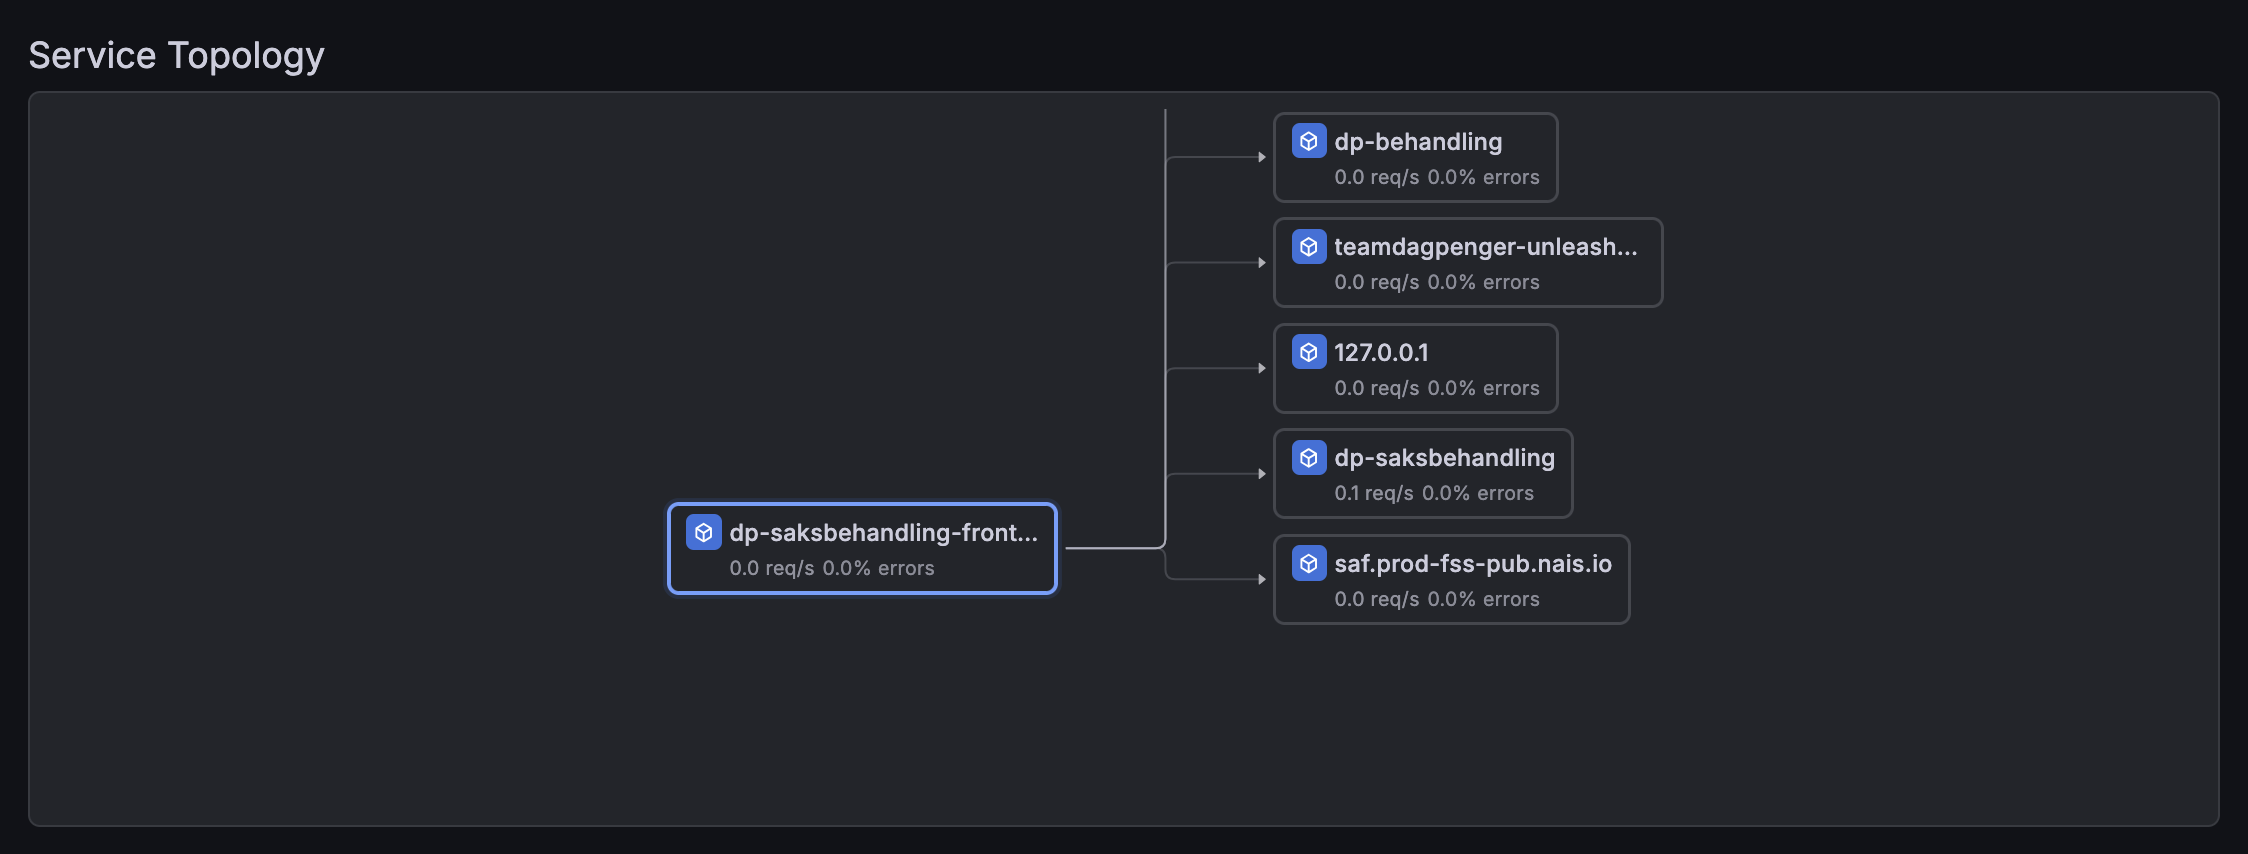
A few applications on Nais use this today (dp-saksbehandling-frontend, dp-brukerdialog-frontend, dp-mine-dagpenger-frontend). It's quick to set up and makes debugging cross-service issues far easier.
How it works 
- The browser sends a
traceparentHTTP header with each API request to your backend - Your backend picks up the trace context and creates child spans under the same trace
- Both browser and backend spans appear together in Grafana Tempo
sequenceDiagram
    participant Browser
    participant Backend
    participant Tempo

    Browser->>Backend: GET /api/data (traceparent: 00-abc123...)
    Backend->>Backend: Process request (child span)
    Backend->>Tempo: Export backend spans
    Browser->>Tempo: Export browser spans
    Note over Tempo: Same trace ID → linked
What you need 
-
@grafana/faro-web-tracinginstalled in your frontend -
propagateTraceHeaderCorsUrlsconfigured inTracingInstrumentation(shown below) - Backend CORS allowing the
traceparentheader - Backend instrumented with OpenTelemetry (or auto-instrumentation) and exporting traces to Tempo
Configure trace propagation in Faro 
Add propagateTraceHeaderCorsUrls to your TracingInstrumentation config. This tells Faro which URLs should receive the traceparent header:
import { getWebInstrumentations, initializeFaro } from '@grafana/faro-web-sdk';
import { TracingInstrumentation } from '@grafana/faro-web-tracing';

initializeFaro({
  url: '...', // collector endpoint
  app: { name: 'my-app' },
  instrumentations: [
    ...getWebInstrumentations(),
    new TracingInstrumentation({
      instrumentationOptions: {
        propagateTraceHeaderCorsUrls: [
          /https:\/\/my-backend\.nav\.no\/.*/,
        ],
      },
    }),
  ],
});
Use a regex or string that matches your backend API URLs. You can list multiple patterns:
propagateTraceHeaderCorsUrls: [
  /https:\/\/my-backend\.test-nais\.cloud\.nais\.io\/.*/,
],
If you build URLs from environment variables, escape them to prevent ReDoS:
function escapeRegExp(str: string): string {
  return str.replace(/[.*+?^${}()|[\]\\]/g, '\\$&');
}

propagateTraceHeaderCorsUrls: [
  new RegExp(`${escapeRegExp(apiUrl)}/.*`),
],
Configure CORS on your backend 
Your backend must allow the traceparent header in CORS responses. Without this, the browser blocks the header and trace propagation silently fails.
Add traceparent to Access-Control-Allow-Headers:
Access-Control-Allow-Headers: Content-Type, traceparentIf you also use tracestate (for vendor-specific trace context), allow that too:
Access-Control-Allow-Headers: Content-Type, traceparent, tracestateOptional: Backend server-timing header 
To correlate backend responses back to the frontend trace, your backend can send a server-timing header containing the trace context. This lets Grafana link the response back to the backend span.
In a Next.js middleware:
// middleware.ts
import { NextRequest, NextResponse } from 'next/server';
import { trace } from '@opentelemetry/api';

export function middleware(request: NextRequest) {
  const response = NextResponse.next();
  const span = trace.getActiveSpan();

  if (span) {
    const { traceId, spanId } = span.spanContext();
    response.headers.set(
      'server-timing',
      `traceparent;desc="00-${traceId}-${spanId}-01"`,
    );
  }

  return response;
}
Verify it works 
- Open your app in a browser
- Open DevTools → Network tab
- Make a request to your backend API
- Check the Request Headers — you should see
traceparent: 00-<traceId>-<spanId>-01 - If you set up the
server-timingheader, check the Response Headers for it - In Grafana Tempo, search for the trace ID — you should see both browser and backend spans
Related 
- Backend context propagation — how to propagate traces between backend services
- Correlate traces and logs — connect traces with structured logs
- Troubleshooting — common CORS and CSP issues